
Fleet control,
zero ambiguity
Fleet control,
zero ambiguity
Fleet control,
zero ambiguity
A responsive web dashboard for monitoring and operating a live fleet of
industrial 3D printers — designed to surface machine state fast and enable
intervention without losing context
A responsive web dashboard for monitoring and operating a live fleet of industrial 3D printers — designed to surface machine state fast and enable intervention without losing context
A responsive web dashboard for monitoring and operating a live fleet of industrial 3D printers — designed to surface machine state fast and enable intervention without losing context
Product Design · End - To - End · Iot
Product Design · End - To - End · Iot
// Context
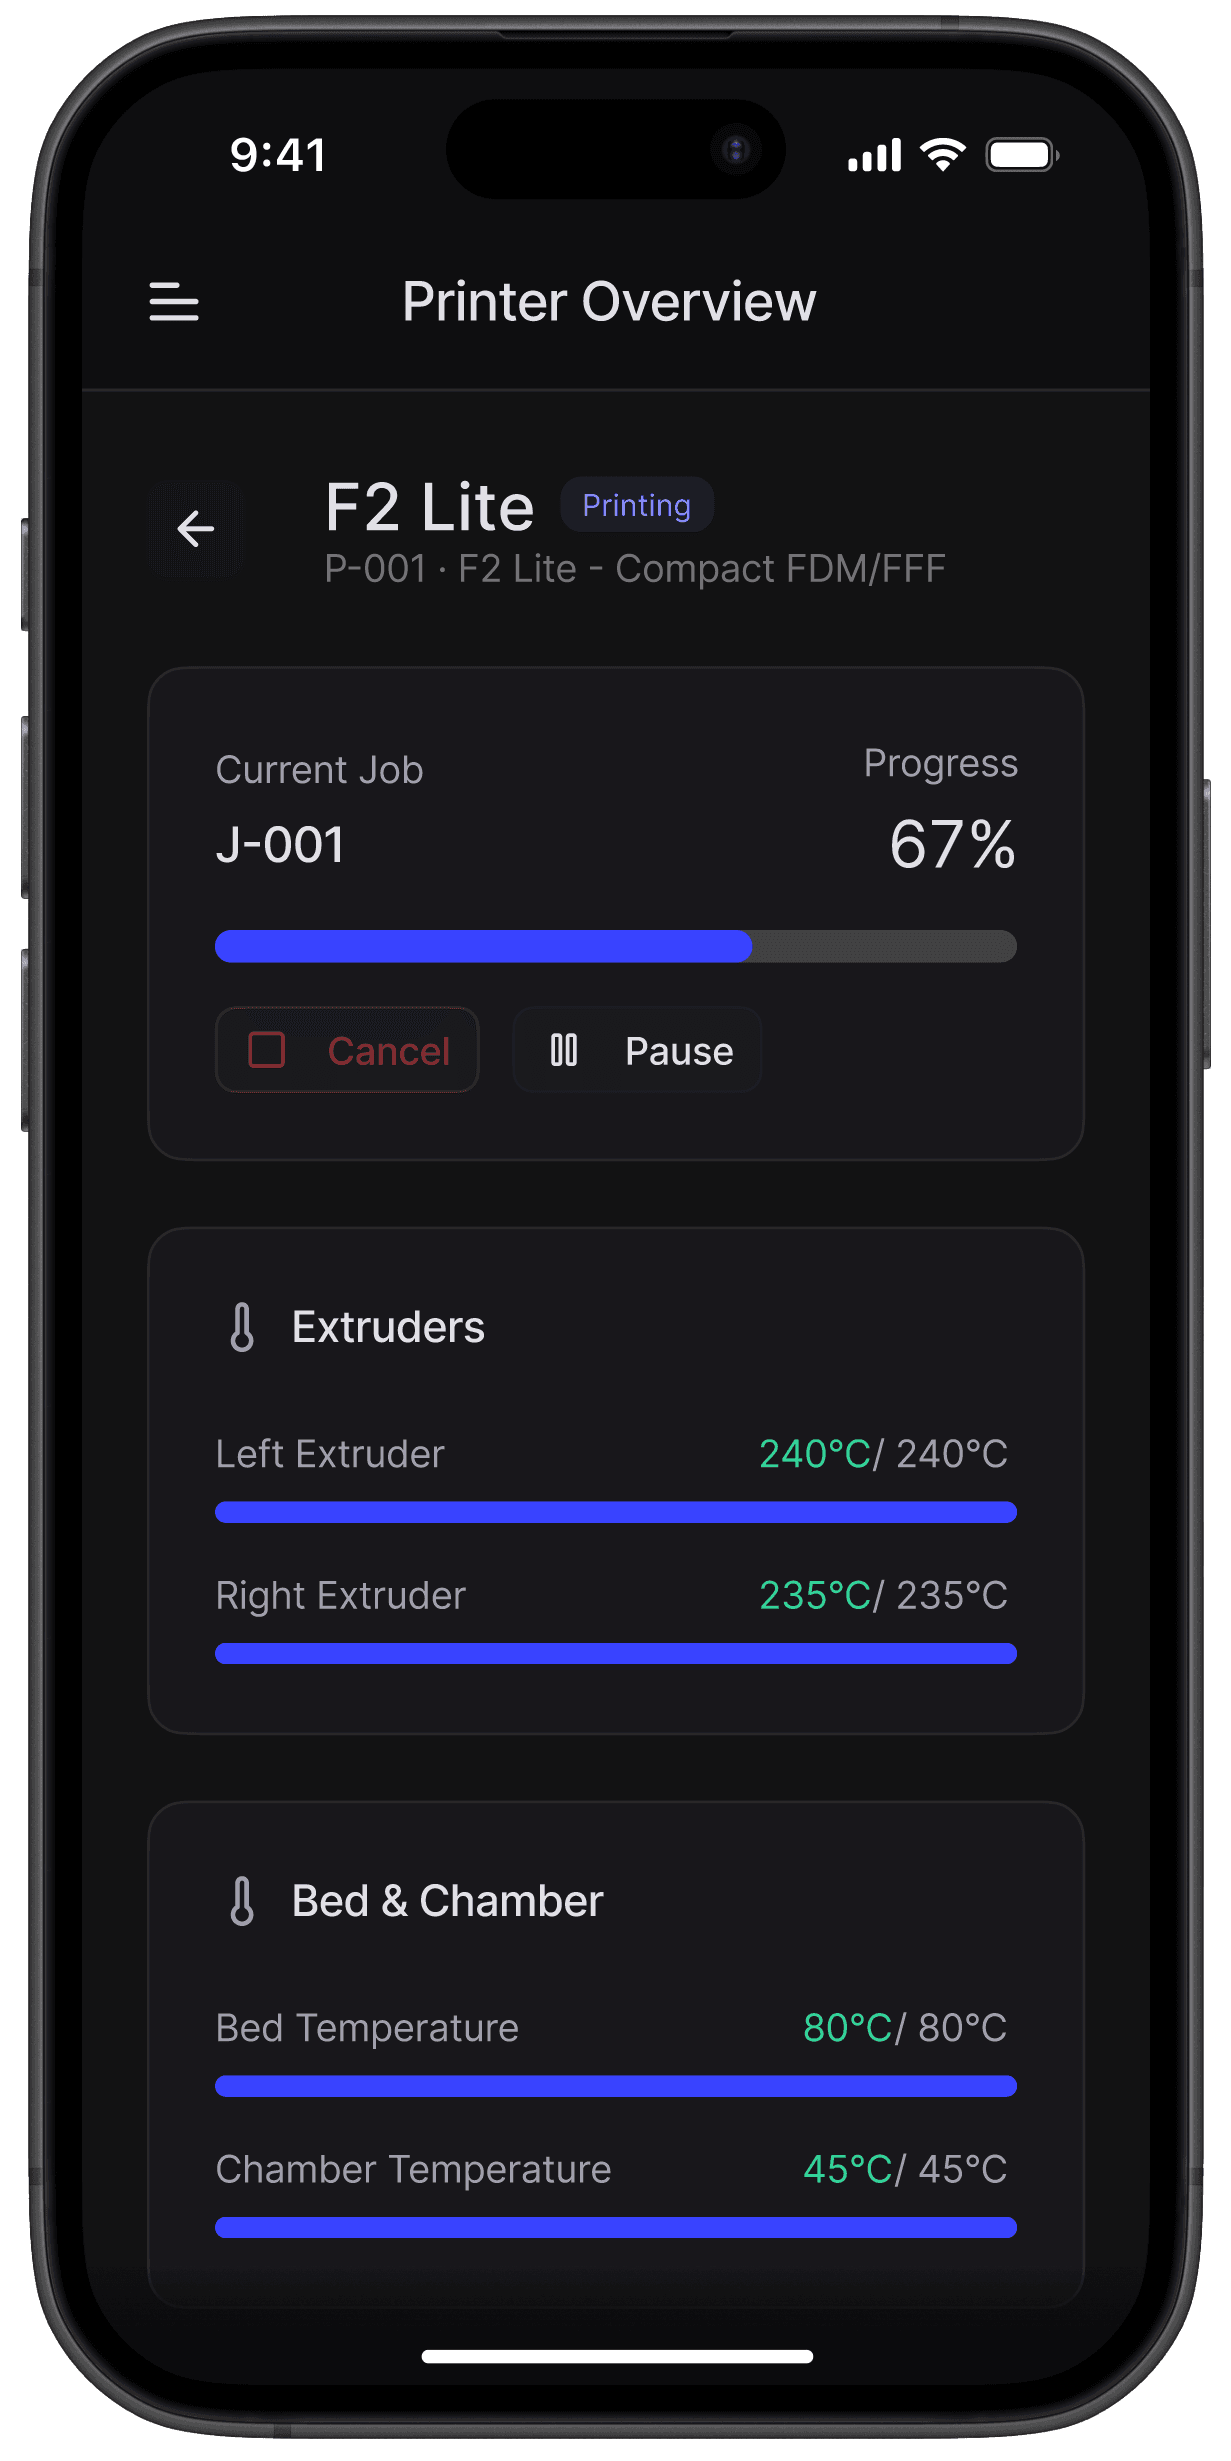
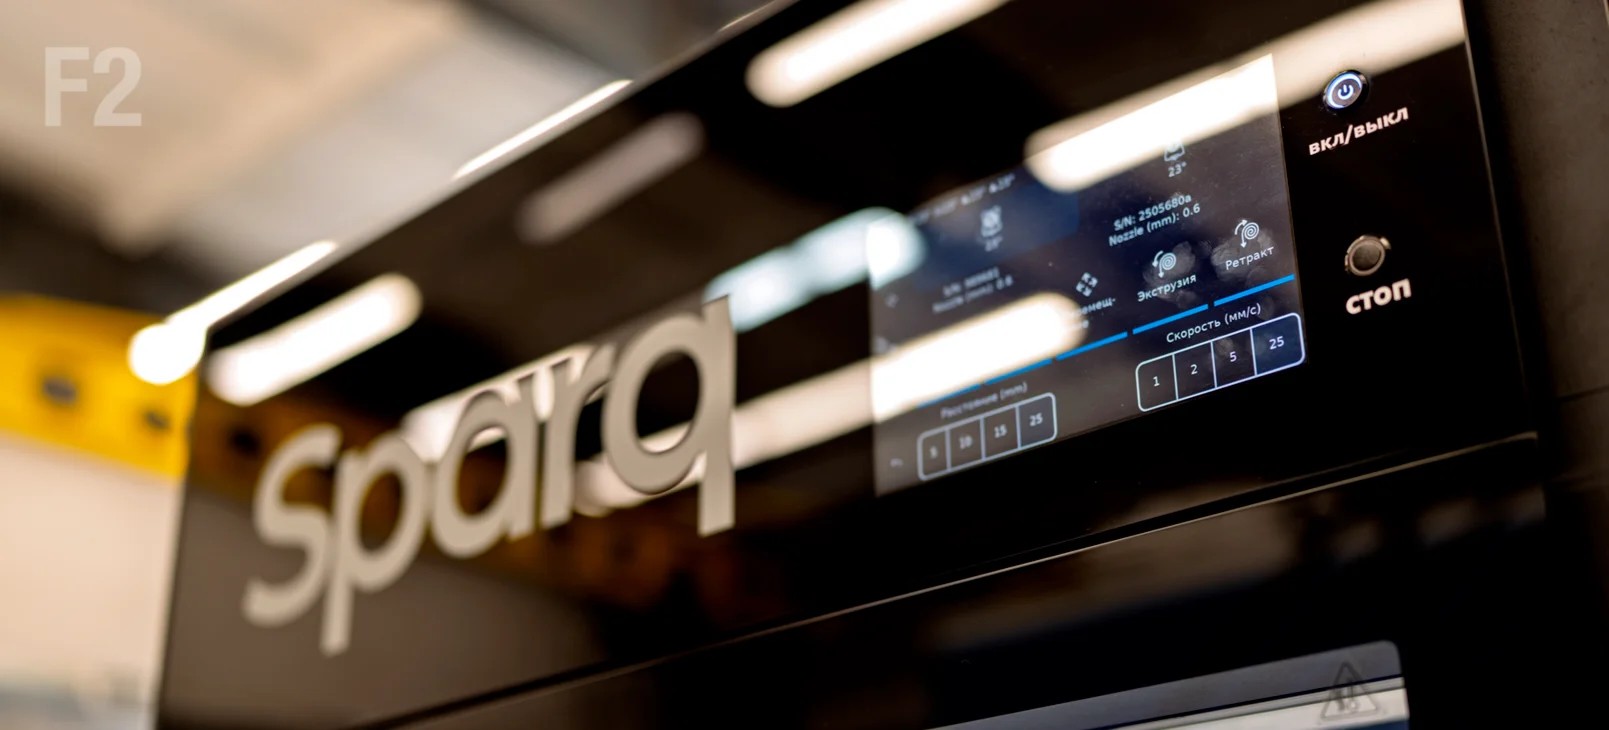
A plant operator is tracking multiple printers at once: active jobs, material consumption, thermal state, and fault conditions across the floor. When a machine fails mid-print, the interface has to show what happened, what is at risk, and what action is safe to take next.
A plant operator is tracking multiple printers at once: active jobs, material consumption, thermal state, and fault conditions across the floor. When a machine fails mid-print, the interface has to show what happened, what is at risk, and what action is safe to take next.
// Problem
These aren't abstract usability goals — each one is a concrete way a fleet dashboard goes wrong in operation.
These aren't abstract usability goals — each one is a concrete way a fleet dashboard goes wrong in operation.
These aren't abstract usability goals — each one is a concrete way a fleet dashboard goes wrong in operation.
Identical machines, identical names
The floor runs two “F2 Pro” and two “F2 Lite” units. Any view that names a machine without placing it invites intervention on the wrong printer.
Metrics that contradict each other
When each screen computes its own numbers, output on the overview disagrees with output in analytics — and the operator stops trusting both.
Alert noise burying the one that matters
Low-stock notices, maintenance reminders, and a critical thermal fault all compete for the same attention. Repetition of one fact across widgets multiplies the noise.
Dashboards that need a hunt
If finding the problem requires scrolling, or worse, visiting three screens, detection time scales with fleet size. The overview must resolve at a glance — on one screen.
Identical machines, identical names
The floor runs two “F2 Pro” and two “F2 Lite” units. Any view that names a machine without placing it invites intervention on the wrong printer.
Metrics that contradict each other
When each screen computes its own numbers, output on the overview disagrees with output in analytics — and the operator stops trusting both.
Alert noise burying the one that matters
Low-stock notices, maintenance reminders, and a critical thermal fault all compete for the same attention. Repetition of one fact across widgets multiplies the noise.
Dashboards that need a hunt
If finding the problem requires scrolling, or worse, visiting three screens, detection time scales with fleet size. The overview must resolve at a glance — on one screen.
// How Overview reads
// How Overview reads
Twelve widgets on one screen resolve in three horizons. Each layer answers a different question, and each takes a different span of attention to read.
Twelve widgets on one screen resolve in three horizons. Each layer answers a different question, and each takes a different span of attention to read.
Twelve widgets on one screen resolve in three horizons. Each layer answers a different question, and each takes a different span of attention to read.
Glance
Horizon 1 — top strip
Live
Horizon 2 — middle band
Decide
Horizon 3 — lower band
Glance
Horizon 1 — top strip
Live
Horizon 2 — middle band
Decide
Horizon 3 — lower band
Fleet state. Machine health.
Job progress. All inline
Fleet state.
Machine health.
Job progress. All inline
203
Total prints
14.3
Avg / week
Mar 17
Peak week
203
Total prints
14.3
Avg / week
Mar 17
Peak week
203
Total prints
14.3
Avg / week
Mar 17
Peak week
F2
F2
// OVERVIEW IN MOTION
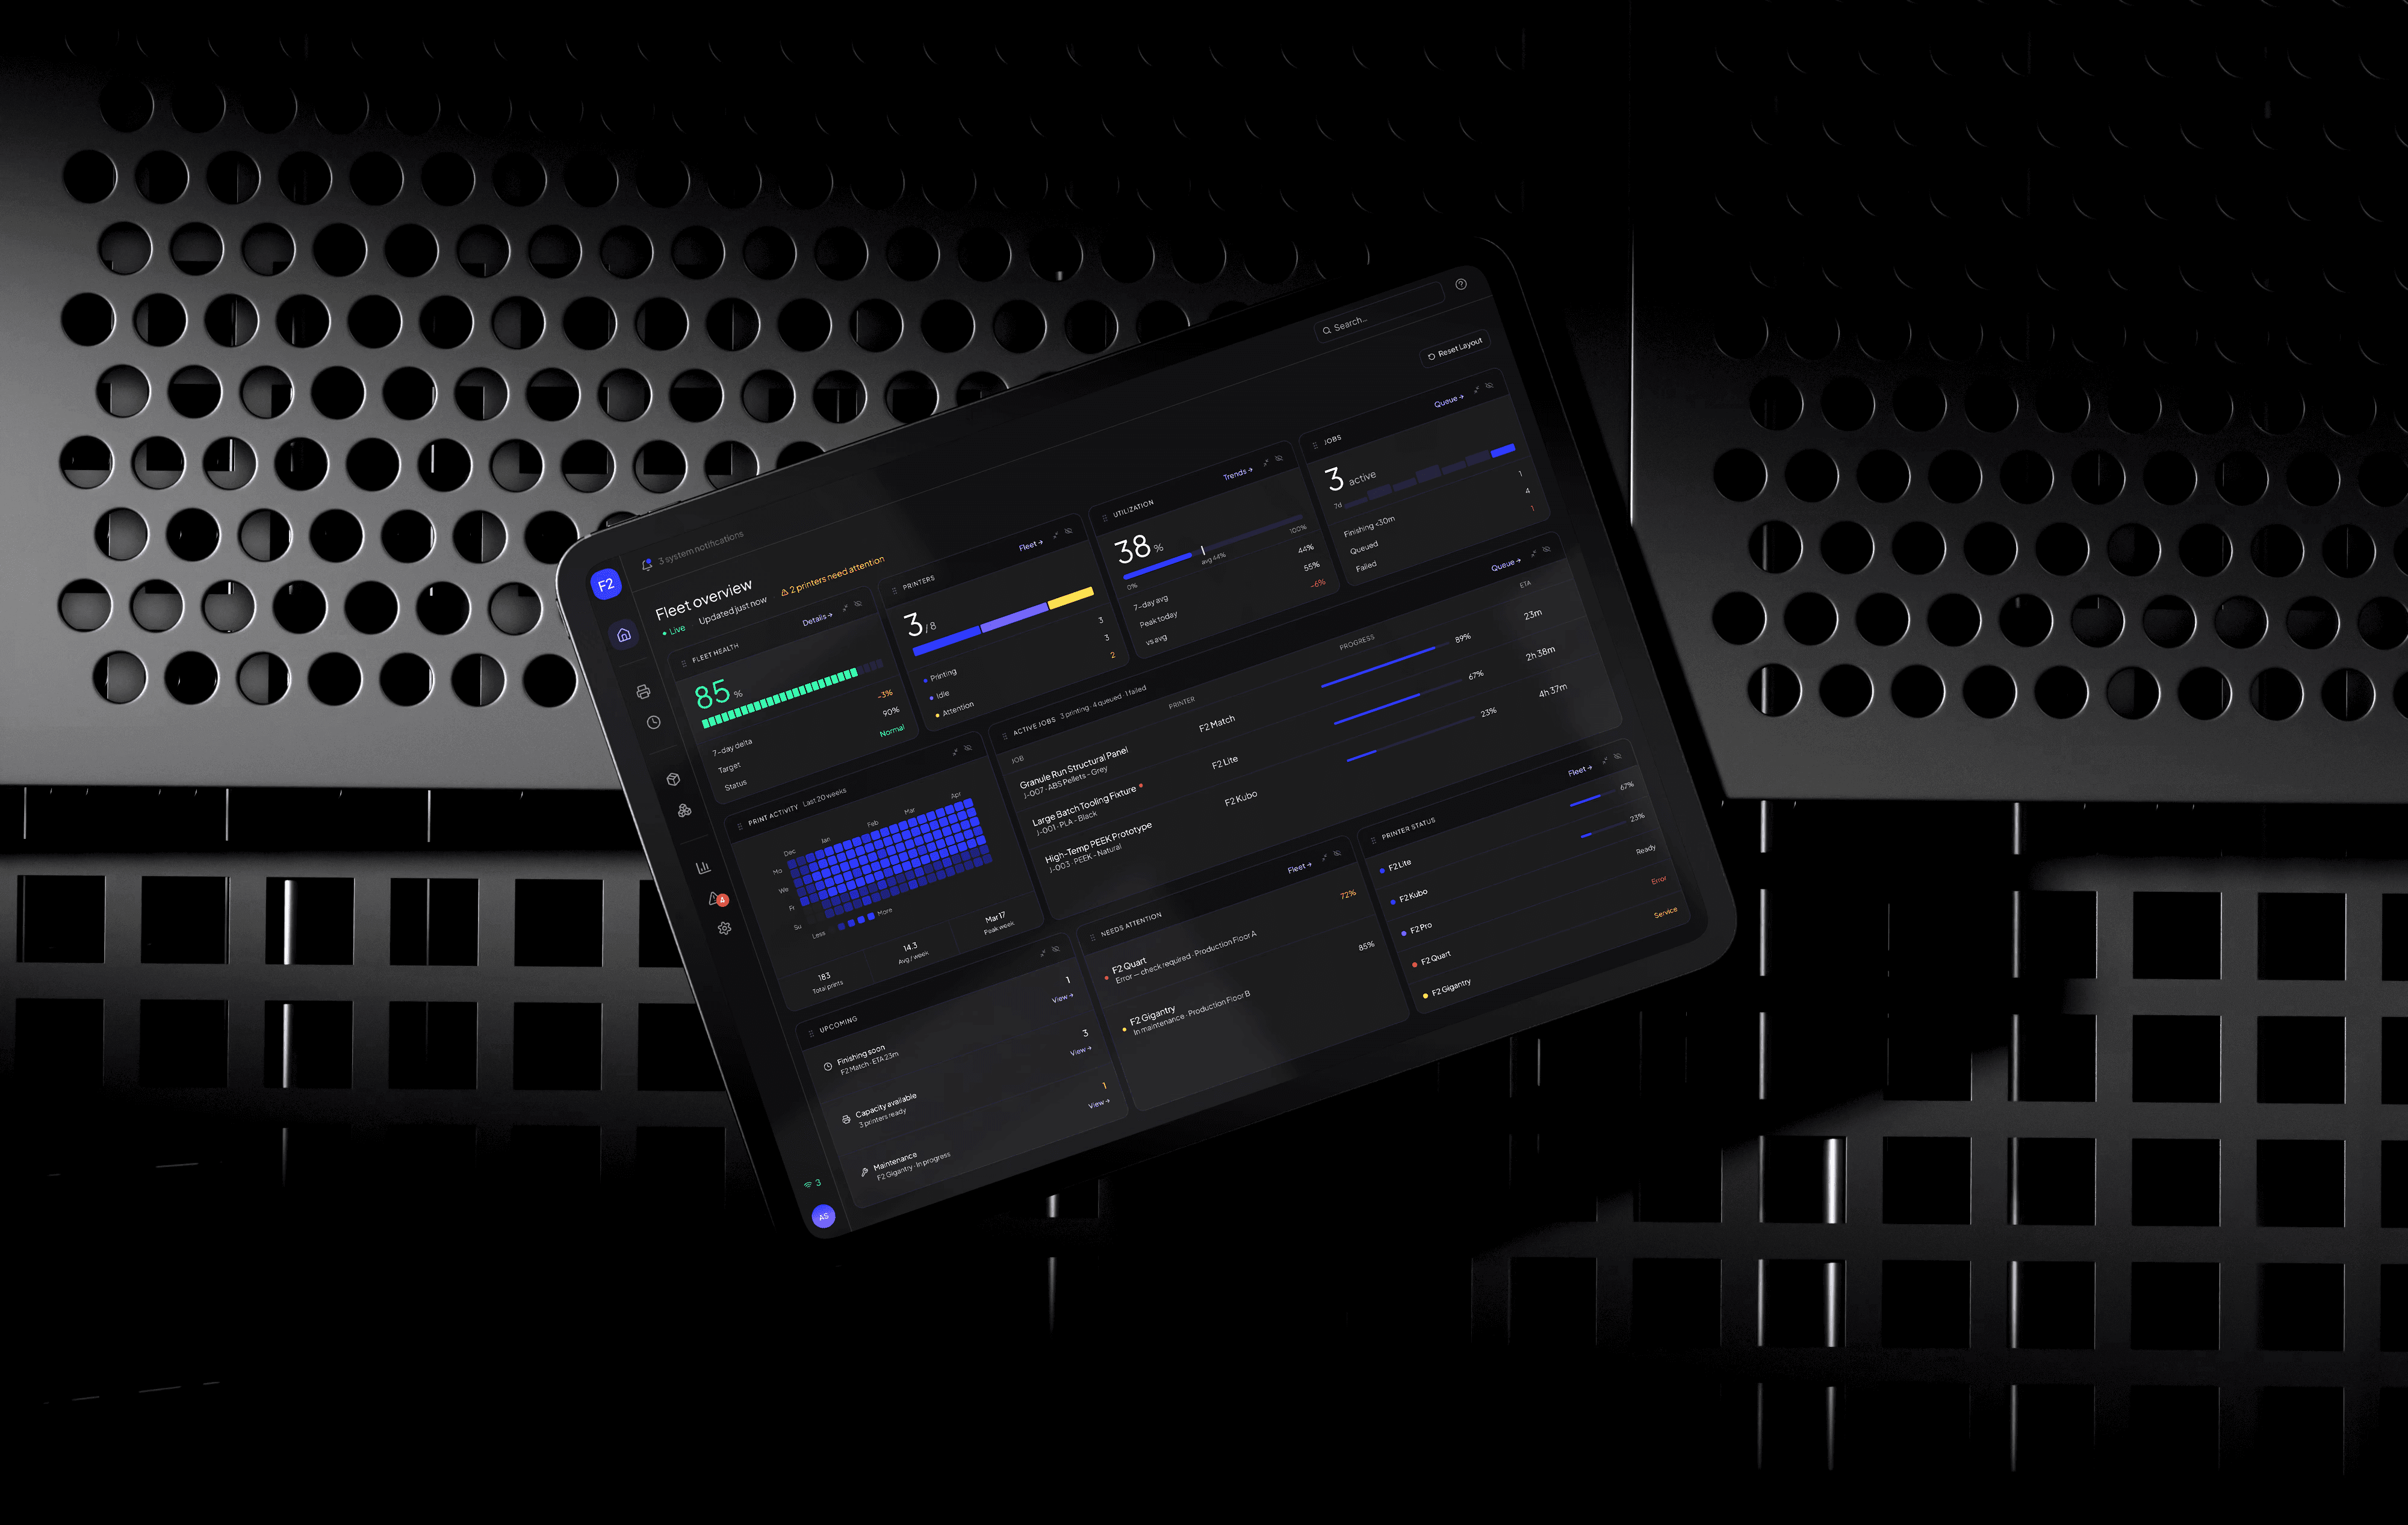
The overview brings machine health, active jobs, alerts, and material risk into one surface. Operators can scan the floor state in seconds and see where intervention is needed next.
The overview brings machine health, active jobs, alerts, and material risk into one surface. Operators can scan the floor state in seconds and see where intervention is needed next.
The overview brings machine health, active jobs, alerts, and material risk into one surface. Operators can scan the floor state in seconds and see where intervention is needed next.
// Process — The system
Overview aggregates across domains; every domain screen owns its facts. Creation lives in Jobs and Models, machines only assign — the same rule everywhere keeps each screen's job unambiguous.
Overview aggregates across domains; every domain screen owns its facts. Creation lives in Jobs and Models, machines only assign — the same rule everywhere keeps each screen's job unambiguous.
Overview aggregates across domains; every domain screen owns its facts. Creation lives in Jobs and Models, machines only assign — the same rule everywhere keeps each screen's job unambiguous.

Printers
Printers
Problems-first fleet list. Duplicate model names are real on the floor, so every row disambiguates by location — and idle rows say what they're ready for.
Problems-first fleet list. Duplicate model names are real on the floor, so every row disambiguates by location — and idle rows say what they're ready for.

Printer detail
Printer detail
A fixed grid in operator-flow order: identity → alert → job + thermals + controls → KPIs → context. The layout is identical for every machine, because operators compare machines by switching between them.
A fixed grid in operator-flow order: identity → alert → job + thermals + controls → KPIs → context. The layout is identical for every machine, because operators compare machines by switching between them.

Error state
Error state
The “why am I here” layer. The alert banner carries the fault context, the job card switches to honest stopped-at math with Retry where the failure lives, and temperature history auto-opens — thermal drift is what the operator came to inspect.
The “why am I here” layer. The alert banner carries the fault context, the job card switches to honest stopped-at math with Retry where the failure lives, and temperature history auto-opens — thermal drift is what the operator came to inspect.
// OPERATIONAL PRINCIPLES
The printers view surfaces what needs attention across the floor. The materials view shows what can slow or block production next. Together, they turn monitoring into operational awareness.
The printers view surfaces what needs attention across the floor. The materials view shows what can slow or block production next. Together, they turn monitoring into operational awareness.
The printers view surfaces what needs attention across the floor. The materials view shows what can slow or block production next. Together, they turn monitoring into operational awareness.

STATE FIRST
STATE FIRST
The production queue owns creation.
The production queue owns creation.
INLINE EXCEPTIONS
INLINE EXCEPTIONS
Warnings surface inline, not after the fact.
Warnings surface inline, not after the fact.
INVENTORY AS SIGNAL
INVENTORY AS SIGNAL
Material status is treated as an operational input, not a back-office metric.
Material status is treated as an operational input, not a back-office metric.
RISK BEFORE SHORTAGE
RISK BEFORE SHORTAGE
Low-stock states appear early enough to protect active jobs and planning.
Low-stock states appear early enough to protect active jobs and planning.


Monitoring
Monitoring
One range control drives every number. All metrics derive from the same data model as Overview — the performance leaderboard here agrees with the dashboard's output widget, digit for digit.
One range control drives every number. All metrics derive from the same data model as Overview — the performance leaderboard here agrees with the dashboard's output widget, digit for digit.
// Design principles
These aren't goals or aspirations — they're constraints that emerged from the operational model. Each one is visible in the product: in the order of elements, in what's in the row, in what mobile doesn't let you do.
These aren't goals or aspirations — they're constraints that emerged from the operational model. Each one is visible in the product: in the order of elements, in what's in the row, in what mobile doesn't let you do.
These aren't goals or aspirations — they're constraints that emerged from the operational model. Each one is visible in the product: in the order of elements, in what's in the row, in what mobile doesn't let you do.
Critical values appear in relation to one another, giving the operator context at a glance and reducing interpretation time.
Rows are arranged by time to attention, so the first item signals where risk is closest and focus should begin.
A missing feed still communicates system state through color, timestamp, and framing, so the operator can place it immediately.
Its role is quick intervention and status checks, with deeper setup reserved for the desktop workflow.
Critical values appear in relation to one another, giving the operator context at a glance and reducing interpretation time.
Rows are arranged by time to attention, so the first item signals where risk is closest and focus should begin.
A missing feed still communicates system state through color, timestamp, and framing, so the operator can place it immediately.
Its role is quick intervention and status checks, with deeper setup reserved for the desktop workflow.
Critical values appear in relation to one another, giving the operator context at a glance and reducing interpretation time.
Rows are arranged by time to attention, so the first item signals where risk is closest and focus should begin.
A missing feed still communicates system state through color, timestamp, and framing, so the operator can place it immediately.
Its role is quick intervention and status checks, with deeper setup reserved for the desktop workflow.
// Design System
Core and semantic token architecture for React responsive Web App. It underpins every spacing, color, and typography decision, structured for implementation.
Core and semantic token architecture for React responsive Web App. It underpins every spacing, color, and typography decision, structured for implementation.
export function StatusBadge() {
  return (
    <span style={{
      fontSize: "var(--typography-caption-fontSize)",
      color: "var(--color-status-success-fg)",
      background: "var(--color-status-success-bg)",
      border: "1px solid var(--color-status-success-border)",
      padding: "0 var(--space-control-sm)",
      borderRadius: "var(--radius-pill)"
    }}>Active</span>
  )
}
Open to new product challenges.
Available for product design work across web, mobile, and connected systems.